Navigate the Modela UI
Once you have installed Modela, and the control plane is up and running, you will be able to connect to the Modela’s frontend application. This will be your primary interface for managing all Modela resources and namespaces.
Connect Using a Domain
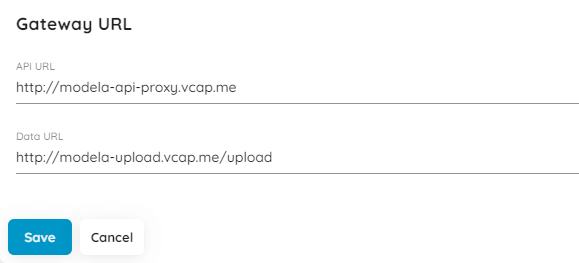
If you have an Ingress controller installed on your cluster (i.e. NGINX), Modela comes pre-installed with Ingress routes that allow you to connect to the frontend application via a URL. By default, the host for this route is modela-app.vcap.me. However, you will need to configure the frontend application to similarly use ingress routes for the API gateway and Data Dock.
Connect Using the CLI
The modela CLI tool provides a command that port-forwards the Modela frontend:
modela system dashboard
The command will utilize the Kubernetes API to port-forward Modela’s pods and will show the following information:
  2021/07/18 20:35:59 [+] Starting Dashboard forwarding
  2021/07/18 20:35:59 [+] Starting modela-frontend forwarding
  2021/07/18 20:35:59 [+] Starting modela-api-proxy forwarding
  2021/07/18 20:35:59 [+] Starting modela-data-dock forwarding
  2021/07/18 20:35:59 [+] Using pod: modela-data-dock-66d497fbc-45hff
  2021/07/18 20:35:59 [+] Using pod: modela-frontend-79cf585844-fbqq5
  2021/07/18 20:35:59 [+] Using pod: modela-api-proxy-7b48fd6b7b-c6h2v
  2021/07/18 20:35:59 [+] Using forwarding: 8095:8095
  2021/07/18 20:35:59 [+] Using forwarding: 8081:80
  2021/07/18 20:35:59 [+] forwarding ports 8081->80
  2021/07/18 20:35:59 [+] Using forwarding: 8080:8080
  2021/07/18 20:35:59 [+] forwarding ports 8080->8080
  2021/07/18 20:35:59 [+] forwarding ports 8095->8095
  2021/07/18 20:35:59 [+] Port forwarding successful (localhost:8081)
  2021/07/18 20:35:59 [+] Issuing open browser http://localhost:8081
Default Login
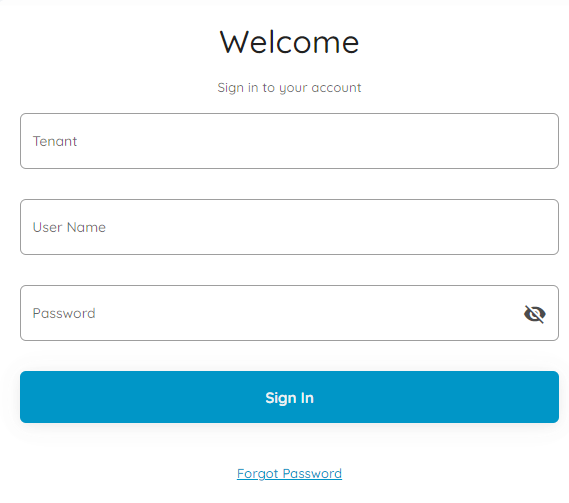
The default username and password for both is admin. The default tenant is default-tenant.
Tenant Interface
Once you have been authenticated, you will be directed to the Tenant dashboard. The Tenant resource represents a namespace which groups infrastructure resources, user accounts, and Data Product namespaces. In addition to the Tenant namespaces, there are unique namespaces for each Data Product, Lab, and Serving Site resource, as well as the Modela Catalog and System.
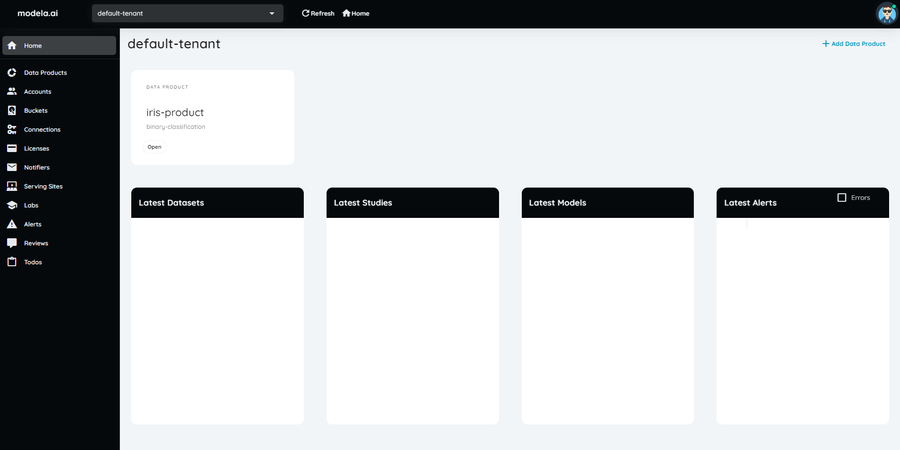
The Tenant interface is divided into four areas:
- Sidebar: Access the dashboard home and all Tenant-level infrastructure resources
- Namespace Selection: Navigate the namespaces available to your account (Data Products, Labs, etc.)
- Data Products: Access the Data Products available to your account
- Latest View: Lists of all the latest Datasets, Studies, Models, and Alerts
Tenant Sidebar Navigation
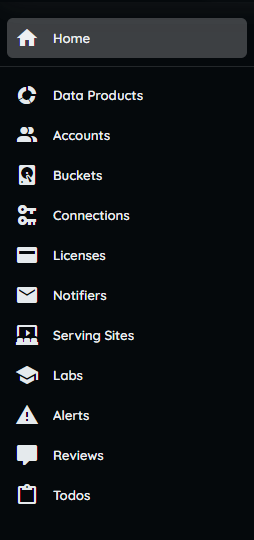 The sidebar provides access to all tenant-level objects. From here, you will be able to:
- Access the Dashboard
- Access the list of Data Products: Data Product namespaces for separate ML use cases.
- Access the list of Accounts: Account are assigned to users and provide access control.
- Access the list of Virtual Buckets: Virtual Buckets store artifacts and other data.
- Access the list of Connections: Connections are used to access external systems.
- Access the list of Notifiers: Notifiers send Alerts to external messaging systems.
- Access the list of Serving Sites: Serving Sites are namespaces for model serving.
- Access the list of Labs: Labs are namespaces for model training and data operations.
- Access the list of Alerts: Alerts list resource events, like completion or error.
- Access the list of Reviews: Reviews contain notes created by collaborators.
- Access the list of Todos: Todos contain to-do lists created by collaborators.
Data Product Interface
After accessing a Data Product namespace, such as the default iris-product Data Product, you will see the following interface:

The Data Product dashboard is divided into three areas:
- Sidebar: To access the dashboard home all Data Product-level infrastructure objects.
- Namespaces Selection: To navigate the namespaces in the system (Data Products, Labs, etc.)
- Latest View: Lists of all the latest Datasets, Studies, Models, and Alerts.
Data Product Sidebar
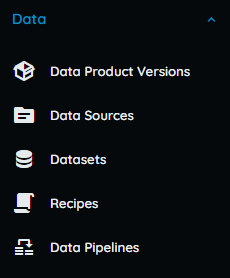
From the Data section of the sidebar you can:
- Access the list of Data Product Version: Create a versioning schema for your data product.
- Access the list of Data Sources: Define the schema and validation rules of your data.
- Access the list of Datasets: Upload, analyze, and automatically profile your data.
- Access the list of Recipes: Define sequential transformation rules for your data.
- Access the list of Data Pipelines: Define your data processsing steps in a pipeline.
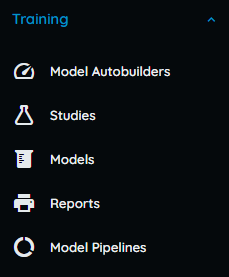 From the Training section of the sidebar you can:
- Access the list of Model Auto Builders: Quickly upload a dataset and train a model.
- Access the list of Studies: Create your model search and define the parameters.
- Access the list of Models: View the progress of your model search in real time.
- Access the list of Reports: Access auto-generated reports of trained models and datasets.
- Access the list of Model Pipelines: Define your model training steps in a pipeline.
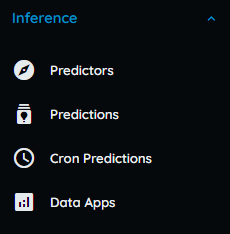 From the Inference section of the sidebar you can:
- Access the list of Predictors: Start a live prediction server for your trained model.
- Access the list of Predictions: Create a batch prediction using your trained model.
- Access the list of Cron Predictions: Make predictions on a predefined schedule.
- Access the list of Data Applications: Create a dashboard for your model using Streamlit.io
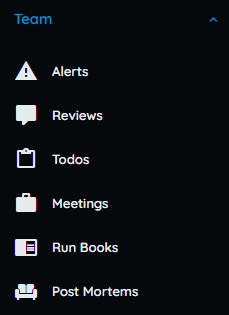 From the Team section of the sidebar you can:
- Access the list of Alerts: View all system alerts like model completion or training error.
- Access the list of Reviews: View all reviews created by other collaborators.
- Access the list of Todos: View all todo-lists created by other collaborators.
- Access the list of Meetings: View all the meetings hosted by collaborators.
- Access the list of Run Books: View procedural notes by other collaborators.
- Access the list of Post Mortems: View post-mortem analyses by other collaborators.
Feedback
Was this page helpful?
Glad to hear it!
Sorry to hear that.